Project Summary: Supermarket Sales and Profit Analysis
Overview: This project involved analyzing a dataset containing over 9,000 entries related to sales and profit data from a supermarket. The primary objectives were to explore patterns in sales, profits, and discounts, and to understand the relationships between various factors such as customer segments, shipping modes, and geographic regions. Additionally, predictive modeling was employed to estimate profits based on other features in the dataset.
Data Analysis:
Descriptive Statistics:
The dataset includes columns such as Ship Mode, Segment, Country, City, State, Postal Code, Region, Category, Sub-Category, Sales, Quantity, Discount, and Profit.
A thorough check revealed no missing values in the dataset.
Summary statistics provided insights into the central tendency and dispersion of the key numerical columns, with Sales ranging from $0.44 to $22,638.48 and Profit ranging from -$6,599.98 to $8,399.98.
Sales and Profit Analysis:
By Category: Sales and profit were analyzed across different product categories (e.g., Furniture, Office Supplies, Technology). The results showed that certain categories, such as Technology, had higher overall sales and profit margins.
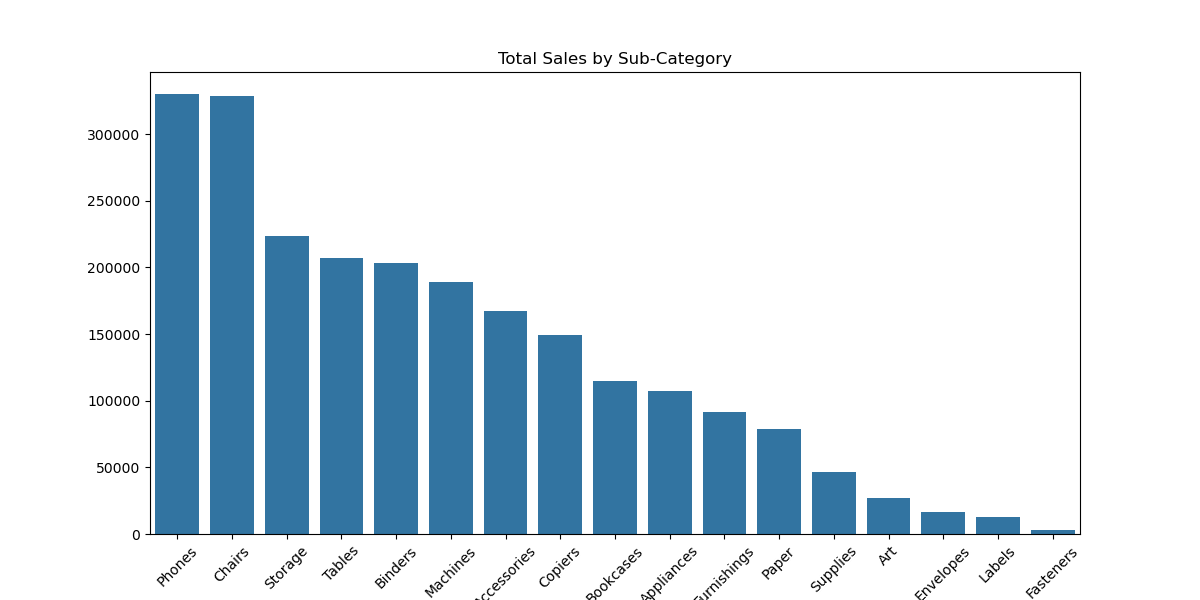
By Sub-Category: Further breakdown by sub-categories highlighted the best and worst performing product lines.
By Region: The West region had the highest total sales and profit, while the Central region lagged behind.
By State: California stood out as the state with the highest sales and profit, while some states, such as Texas and Ohio, showed significant losses.
Customer Segment Analysis:
Sales and profit were analyzed across different customer segments (Consumer, Corporate, and Home Office). The Consumer segment generated the highest sales, while the Corporate segment had the highest profit margins.
Shipping Mode Analysis:
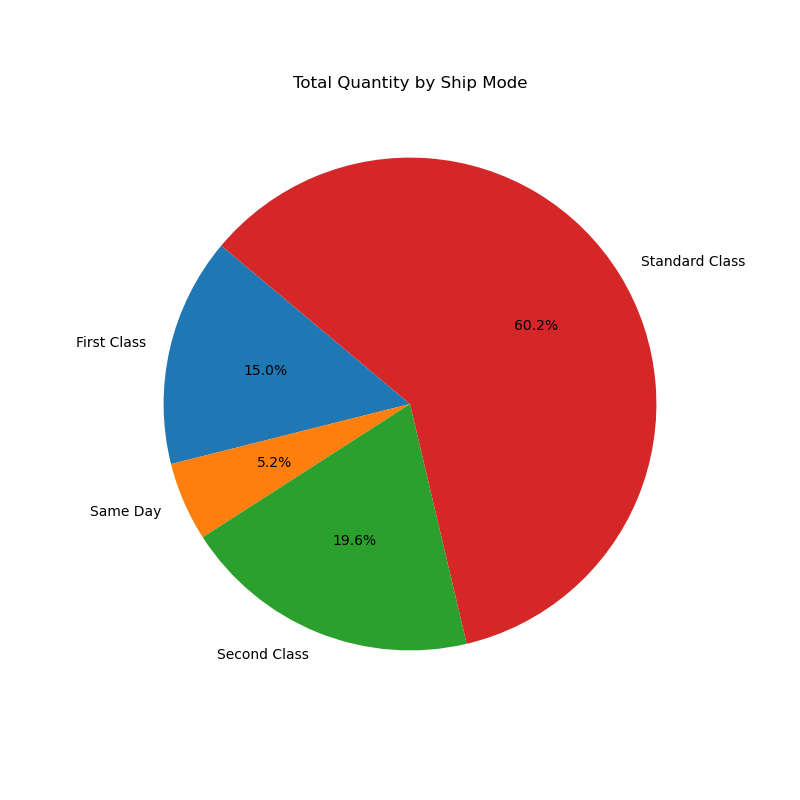
The impact of different shipping modes on sales and profits was examined. It was found that Standard Class shipping generated the highest sales, while First Class had the best profit margins.
Discount Impact on Profit:
A detailed analysis of how discounts impacted profits was conducted. A negative correlation was found, indicating that higher discounts generally led to lower profit margins.
Predictive Modeling:
Linear Regression Model:
A linear regression model was built to predict profit based on various features in the dataset, including sales, discount, quantity, and categorical variables like state and category.
Model Performance:
Mean Squared Error (MSE): 78,987.01
Root Mean Squared Error (RMSE): 281.05
R-squared (R²): -0.63, indicating that the model did not fit the data well, likely due to the complexity and non-linear relationships in the dataset.
Visualizations:
A scatter plot of actual vs. predicted profits revealed significant deviations, highlighting the model's limitations.
A residual plot further illustrated the model's errors, showing a distribution of residuals with a high degree of variance.
Key Findings:
Regional and State Variability: Sales and profit distribution varied significantly across regions and states, with some states showing consistent losses despite high sales.
Impact of Discounts: Discounts had a noticeable negative impact on profit margins, suggesting a need for a more strategic approach to discounting.
Customer Segment Focus: Different customer segments contributed differently to sales and profits, with the Corporate segment showing high profitability despite lower sales volume.
Modeling Limitations: The linear regression model did not perform well in predicting profits, indicating that more advanced modeling techniques or additional features might be required for accurate predictions.
Conclusion: This project provided valuable insights into the supermarket's sales and profit distribution across various dimensions, such as product categories, regions, and customer segments. However, the complexity of the data suggests that more sophisticated modeling approaches may be necessary for accurate profit prediction. These findings can guide strategic decisions in marketing, pricing, and inventory management to optimize profitability.


